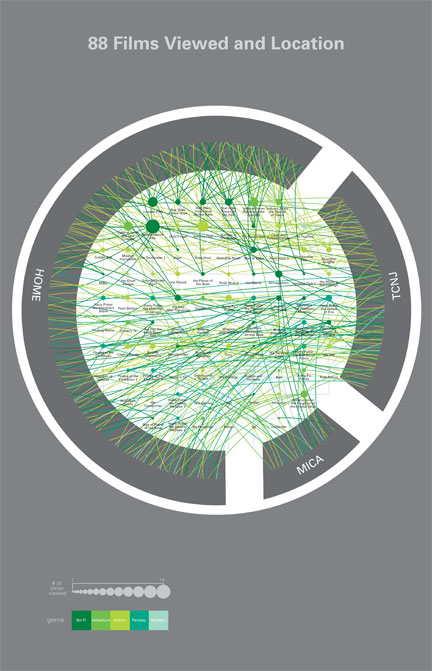
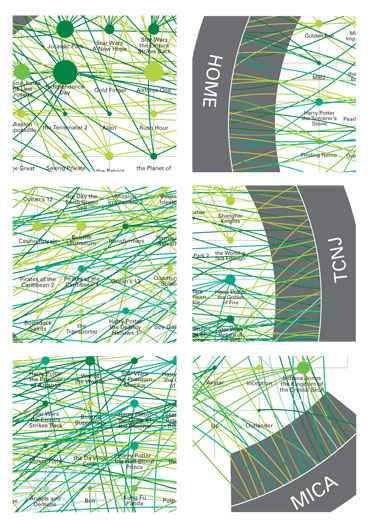
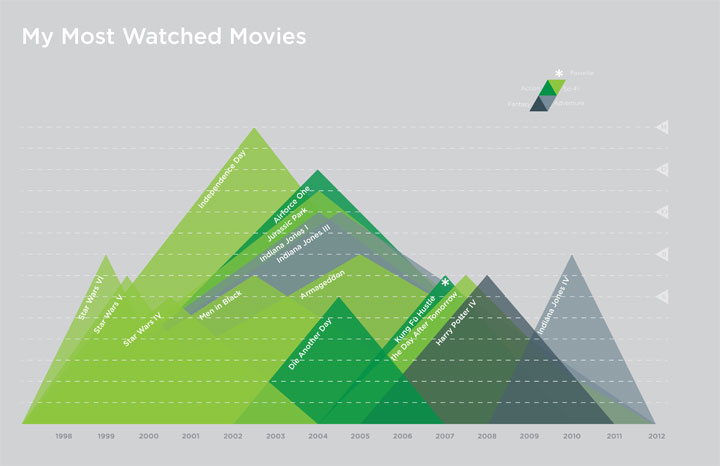
I designed two data visualizations about the movies I have watched over the years. The first is my "map," showing 88 movies, how many times I watched each one, and where I watched them. The seccond is my area chart showing my most watched movies, how many times I watched each one, and the period of time over which I watched them.